
by b.kelly
How Well-used was the IWMW 2010 Blog?
4:29 pm in technologies by b.kelly
How well-used was the IWMW 2010 blog? Looking at the Google Analytics summaries for the month of July 2010 the following information is available.
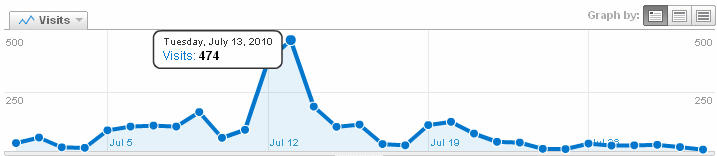
During July there were 2,696 visits. As might be expected, and illustrated in the graph, the blog was visited the most during the three days of the event, with the peak of 474 visits taking place on Tuesday 13 July 2010, the second day of the event.
<a href="http://iwmw.ukoln.ac.uk/blog/2010/wp-content/uploads/2010/08/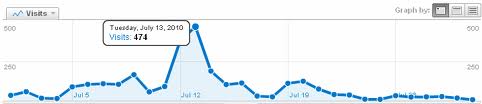 “>
“>
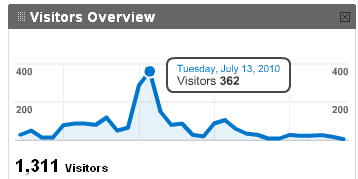 But how many visitors came to the blog?
As shown in the accompanying image once again the peak occurred on the second day of the event, with 363 visitors.
Overall during July 2010 there were 363 visitors, according to the statistics provided by Google Analytics.
The browser statistics are not very interesting: 37.7% of the views came from Firefox; IE was in second place with 21.5% followed by 17.8% for Safari and 17.6% for Chrome.
64% of the views came from browsers running MS Windows with the Macintosh OS in second place with 25%. However Apple were also in the 3rd, 5th and 6th places with 5%, 1.4% and 1.2% of the market for the iPhone, iPod and iPad devices. Linux was in 4th place with 1.6% with Android devices trailed at 1%.
I’m note quite sure what these statistics might tell us, but I feel it is worth publishing these summaries as this information might be used to support decisions on the provision of blog to support events in the future and to enable comparisons to be made.